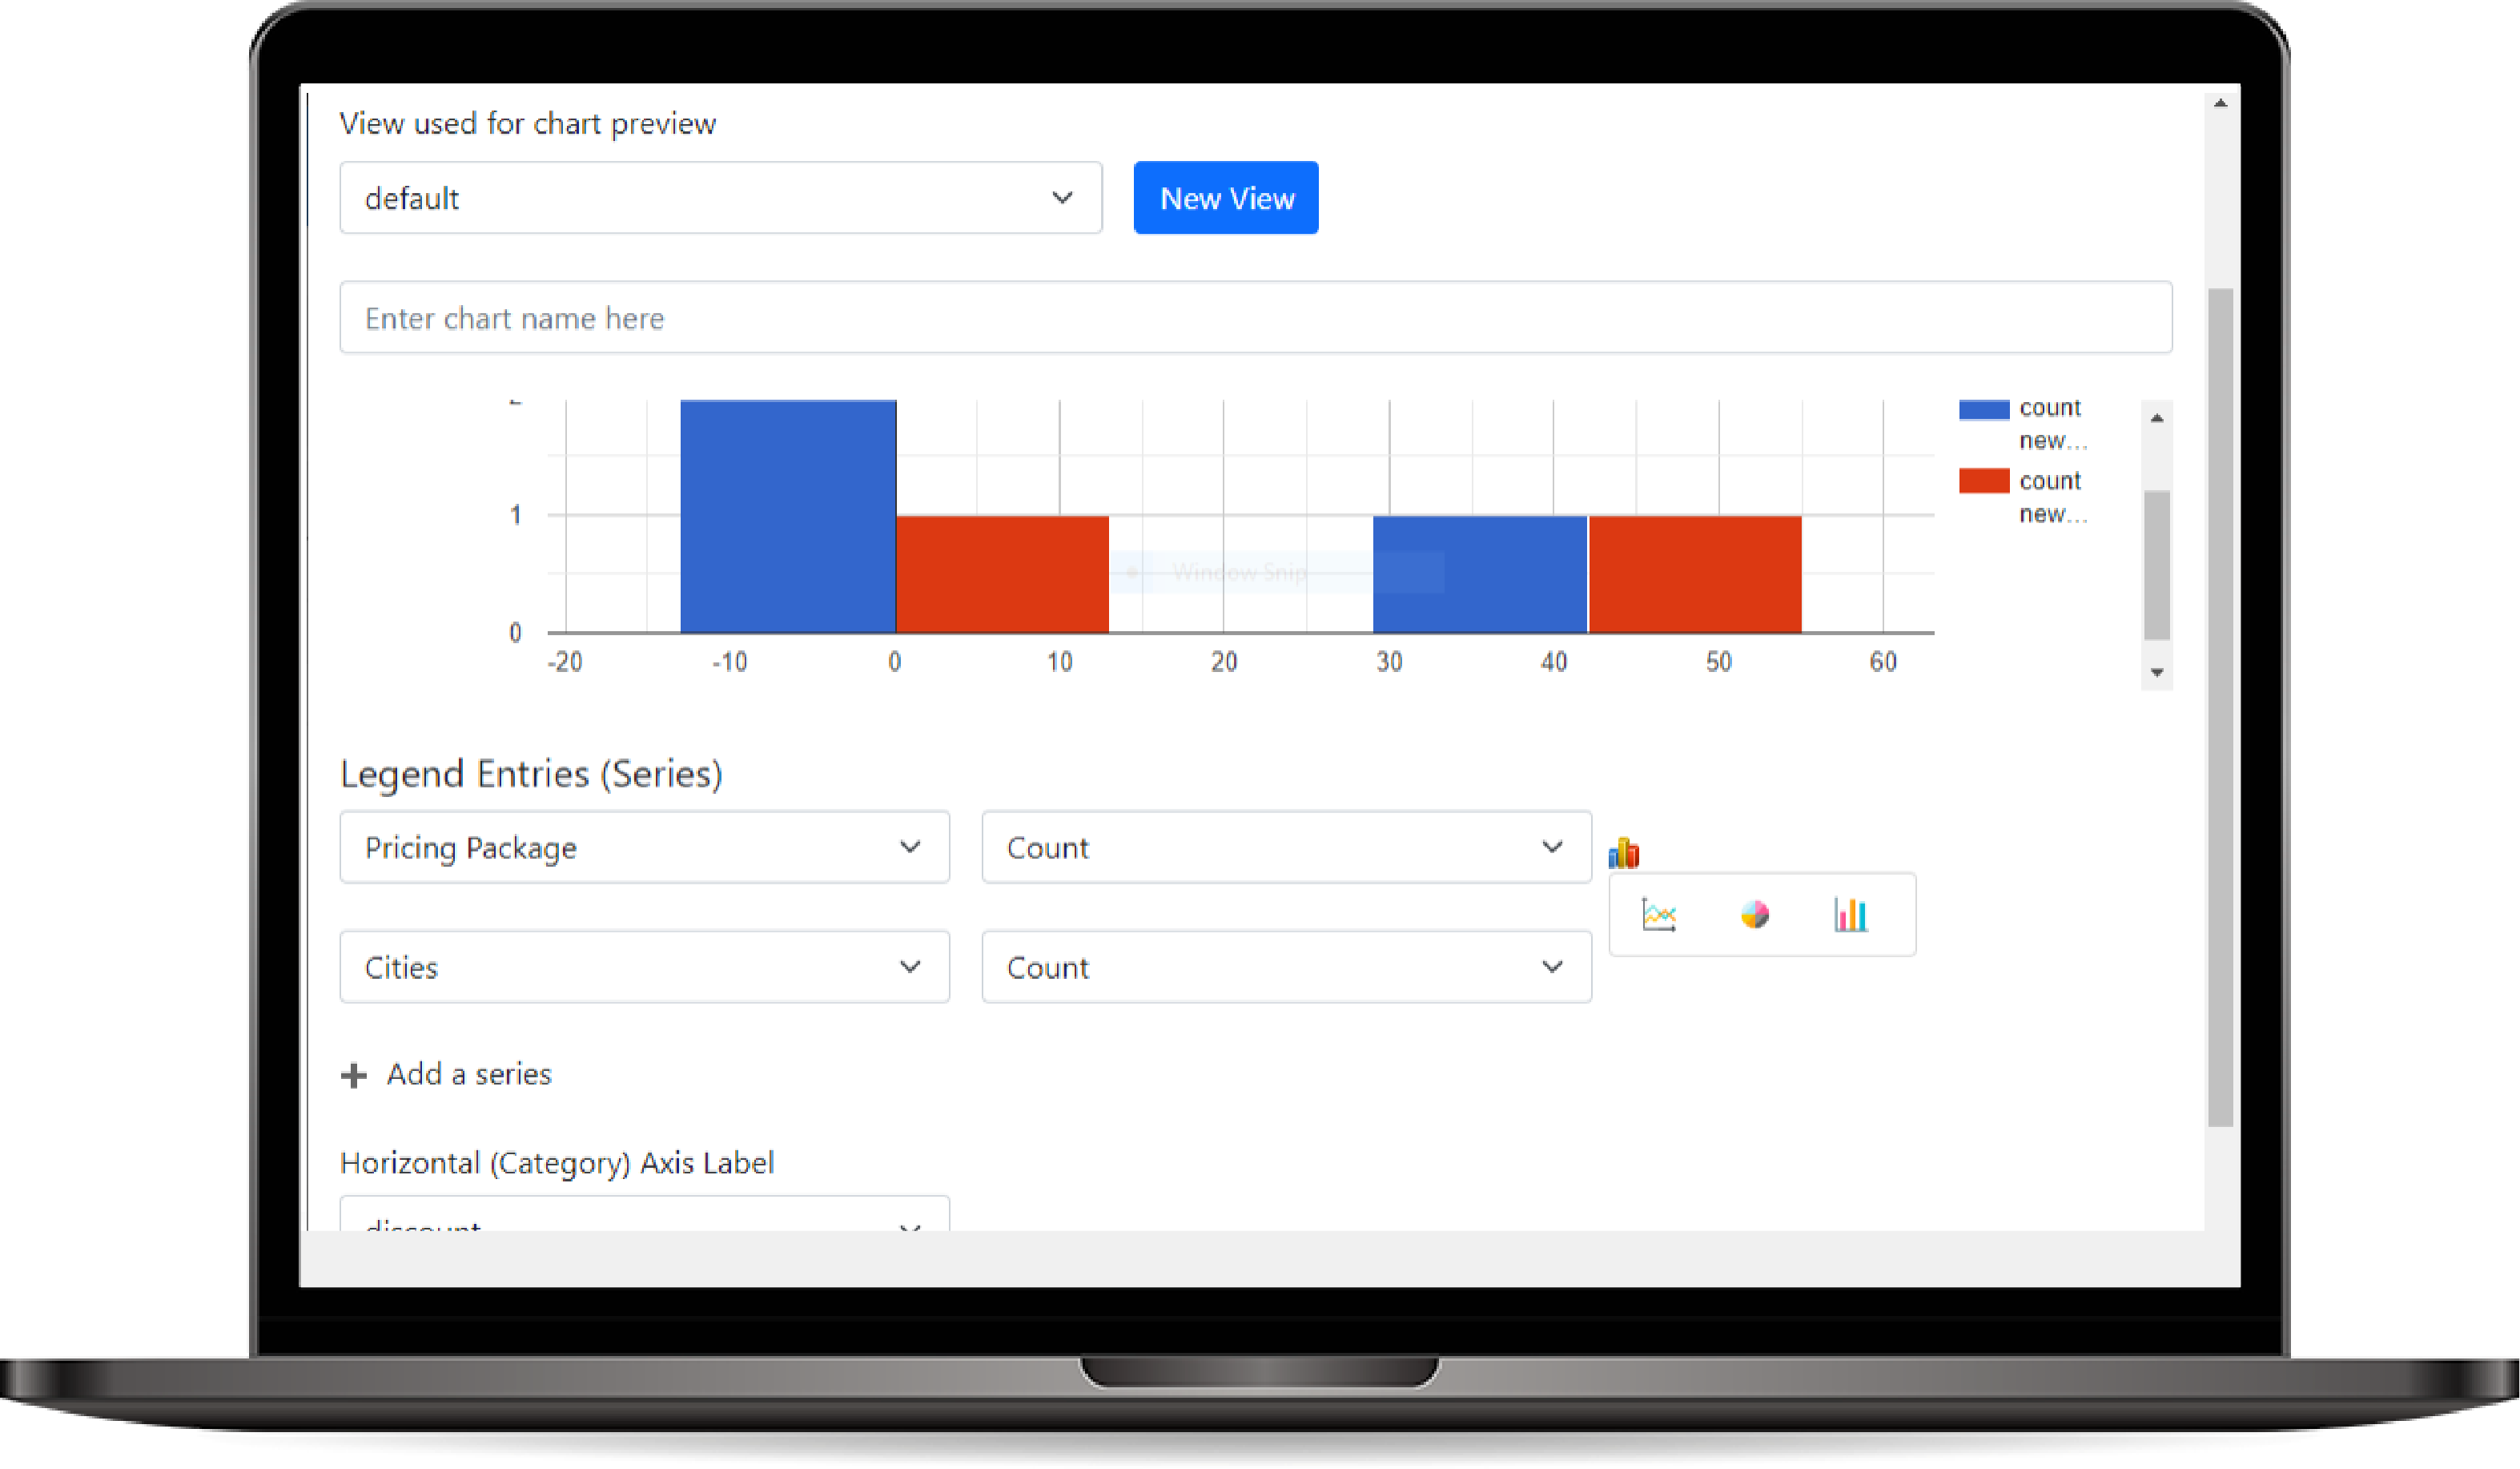
Chart Editor
The Chart Editor allows users to create and customize various types of charts to visualize data related to entities. Users can define data series, select chart types, and configure display settings, enabling insightful data analysis and better decision-making.
How to use Chart Editor?
- Accessing the Chart Editor:
- Navigate to the Chart Editor from the UI.
- Select the entity for which you want to create or modify a chart.
- Creating a New Chart:
- Click on Create New Chart to start a new chart configuration.
- Provide a Name for the chart (e.g., "Sales Overview", "Customer Trends").
- Customizing Chart
- Chart Title: Enter a title for the chart to provide context.
- Data Source: Select View that chart will be created based on it.
- Y-Axis Series: Select the field that will represent the data value on the Y-axis.
- X-Axis Category: Select the field that will define the categories or labels on the X-axis
- Saving and Publishing the Chart:
- After configuring the chart, click Save to store your settings.
- To make the chart available for use in dashboards or reports, click Publish. This action will apply the chart configuration and allow users to access it as needed.